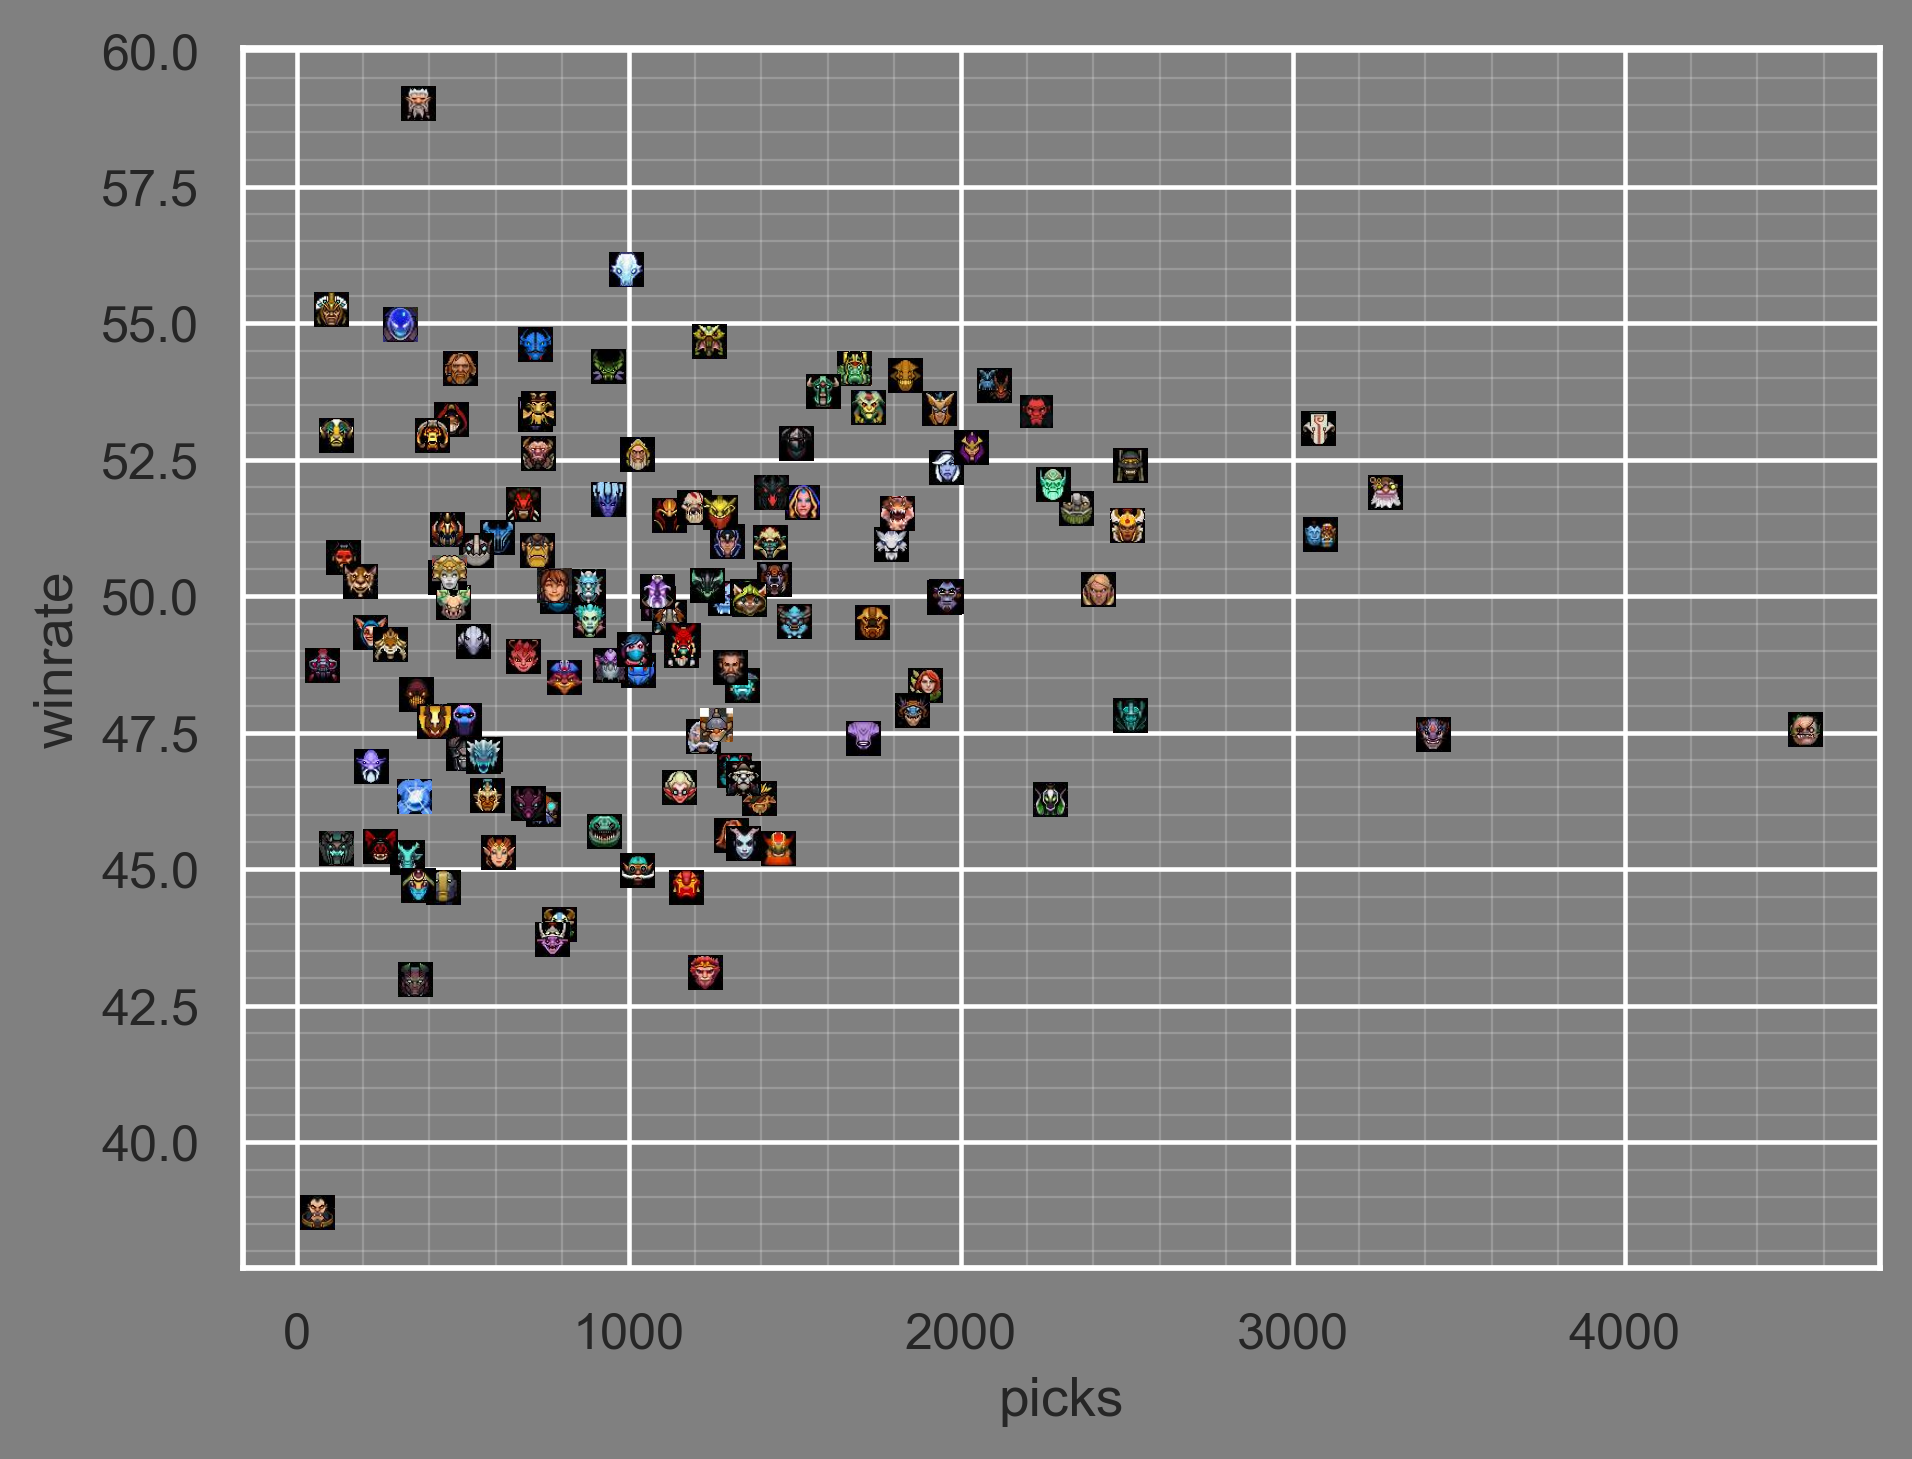
Meta Scatter Plot
This is a scatter plot that visualizes each hero's prevalence in the metagame by representing their winrate and pickrate in relation to each other. Popular heroes trend towards the right side, high winrate heroes trend towards the top. Less popular and unsuccessful heroes trend towards the bottom left.
If you don't know what hero an icon represents, check here for a list: Hero Minimap Icons
